A CAB Candle is a price action structure used to identify directional commitment within a market. The acronym defines its core criteria:
(C)loses beyond the previous candle’s high or low

(A)bove average

(B)ody length
Understanding CAB candles isolates meaningful directional progress from market noise, clarifying current momentum and market structure.
Identification & Structural Relevance
CAB candles are most clearly identified using Japanese candlestick charts, as the visual emphasis rests on the real body rather than Open/High/Low/Close (OHLC) bars.
Identification Criteria
- Ignore Wicks Initially: Focus exclusively on the real body length of each candle.
- Scan for Relative Expansion: Identify candles with bodies noticeably longer than surrounding candles.
- Confirm Directional Close: Ensure the candle closes beyond the prior candle’s high (bullish) or low (bearish).
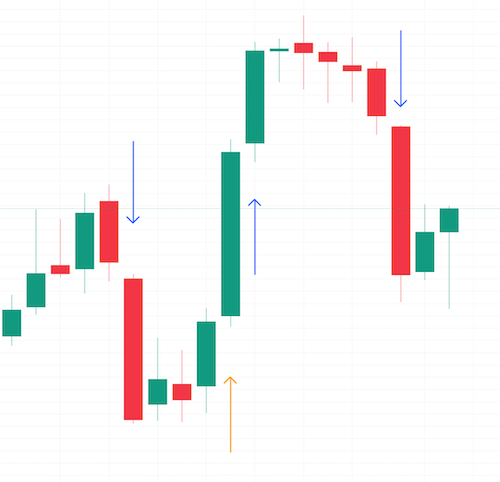
Gauging Relative Significance
The CAB classification is not purely binary; significance exists on a spectrum determined by relative body length.
- Higher Significance: Candles displaying extreme expansion relative to recent price action indicate aggressive institutional participation (e.g. the long-bodied candle indicated by the orange arrow in image shown above).
- Lower Significance: Candles that technically meet the close and length requirements, but exhibit only minor expansion relative to the preceding range, carry less structural weight.
Objective Quantification: The ATR Standard
While visual inspection is often sufficient, an objective rule for “above-average body length” can be defined using the 14-period Average True Range (ATR).
- Bodies Represent Final Progress: Wicks denote intraday price rejection and volatility, whereas the real body represents accepted price progress upon candle close.
- The ATR Benchmark: Because the 14-period ATR measures the total range (high-to-low) of surrounding candles, a valid CAB candle should feature a real body length that exceeds the average total range of the benchmark period.
When a candle body exceeds the full high-to-low average of prior sessions, price has achieved statistically significant progress in that direction.
Defining the CAB Threshold
The CAB Threshold establishes the structural boundary of the move. This level serves as a reference point for market acceptance and structural invalidation.
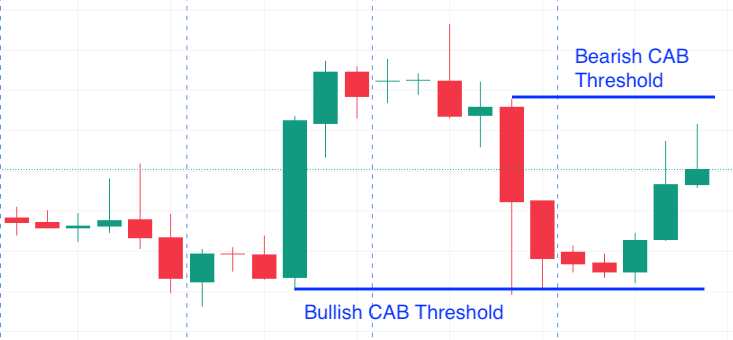
Standard Threshold Rules
- Bullish CAB Candle: The threshold is set at the absolute low of the candle, including the lower wick.
- Bearish CAB Candle: The threshold is set at the absolute high of the candle, including the upper wick.
Special Case: The 50% Wick Rule
When a CAB candle forms with an abnormally long wick at its base (rejection prior to expansion), using the absolute extreme can distort the structural anchor.
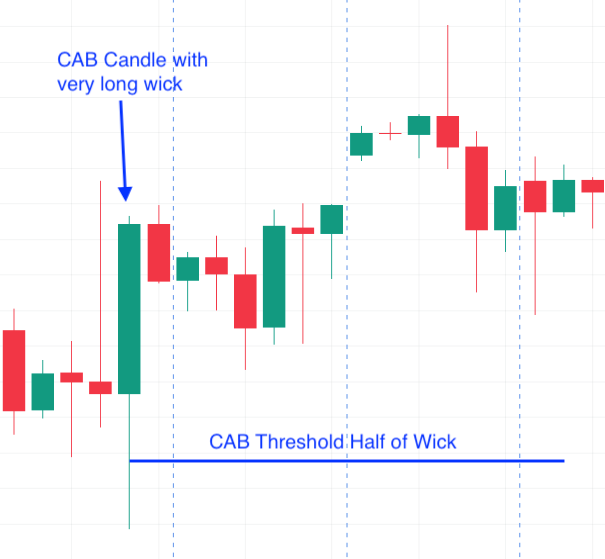
- Bullish CAB with Long Lower Wick: Place the threshold at the 50% midpoint of the lower wick.
- Bearish CAB with Long Upper Wick: Place the threshold at the 50% midpoint of the upper wick.
Structural Invalidation
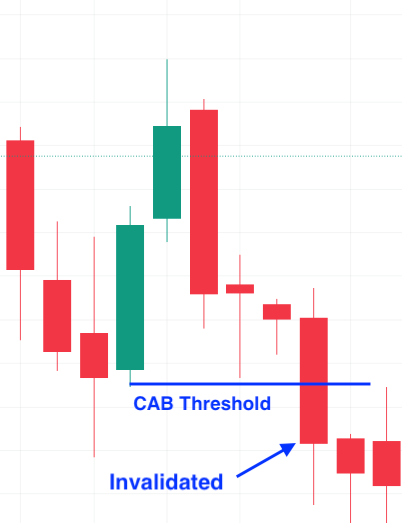
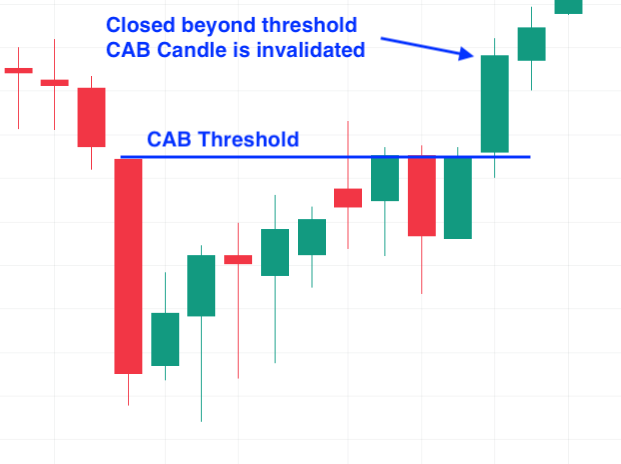
A CAB candle remains active and structurally relevant until price closes beyond its established threshold. Once a subsequent candle closes past this line, the CAB candle is considered invalidated and is removed from active analysis.
Bearish CAB Invalidation
A bearish CAB candle is invalidated when a future candle closes above the bearish threshold.
Bullish CAB Invalidation
A bullish CAB candle is invalidated when a future candle closes below the bullish threshold.